University of Adelaide researchers raise awareness on the importance of satellite imagery for mapping bushfire impacts
The Conversation features lessons learnt by Boone Law as he mapped bushfire impacted areas on Kangaroo Island.
By PhD candidate Wallace Boone Law with contributions from Megan M. Lewis.
My recent experience suggests there is a considerable knowledge gap between ‘Big Satellite Data’ and ‘those who need it’. Megan and I share the concern that neither the general public nor decision makers are fully aware of the range of information Earth Observation satellites can provide, nor is there a good understanding of the advanced technical skills needed to access and process imagery into useful map data. We recognise that there is a bottleneck in delivering useful information to the public, with a sea of data-rich satellite imagery available at one end and a huge unmet demand at the other.

Image: At home on Kangaroo Island - Sarah, Kiva and Boone Law.
Below are a handful of examples demonstrating a range of information that multispectral satellites offer, subject to appropriate image selection and processing. I believe that these kinds of end-products are what spatial scientists should aim to make mainstream during a major bushfire event and shortly afterwards. I would like to see them become as common as a weather map and be easily understood by all. The images reproduced here are from various stages of the Kangaroo Island bushfires, presented in chronological order. These images are meant to illustrate some of the valuable geospatial and environmental remote sensing information that could support bushfire management, immediate recovery and longer term planning efforts.
As It Unfolded – The Kangaroo Island Fires Seen Through Satellite Imagery
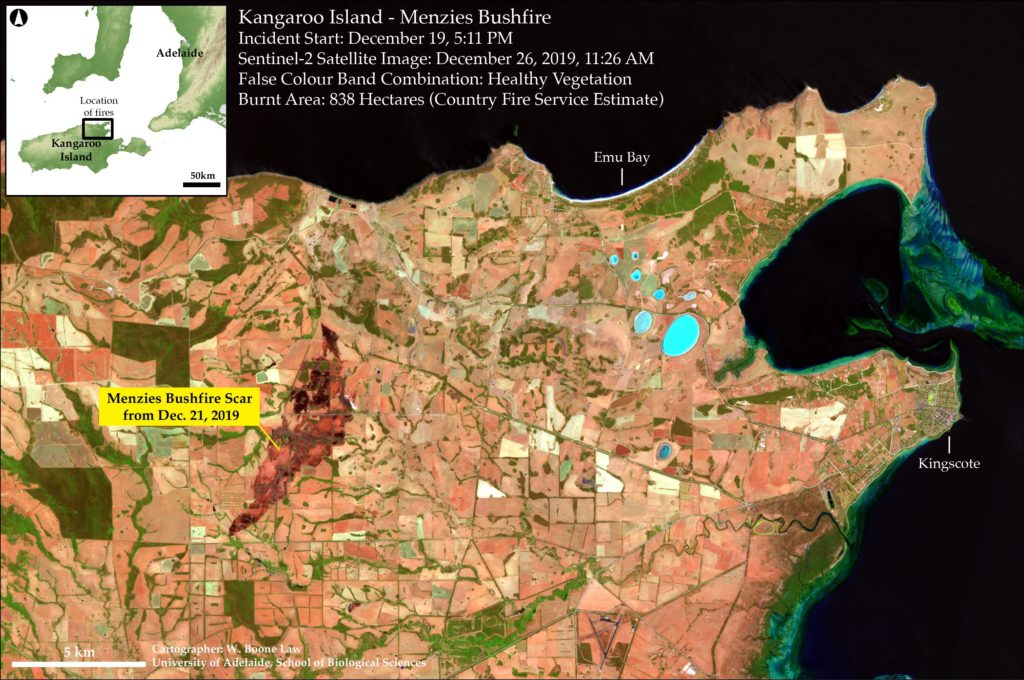
The first large bushfire on Kangaroo Island this season began with a lightning strike on December 19, 2019 in the Menzies region of the island. The following Sentinel-2 false colour image discriminates healthy vegetation (green) from dry (light tan) to burnt vegetation (reddish brown to black) and clearly shows the outline of the burnt area. Note that the burnt area is roughly equivalent to the urban township area of Kingscote (east).
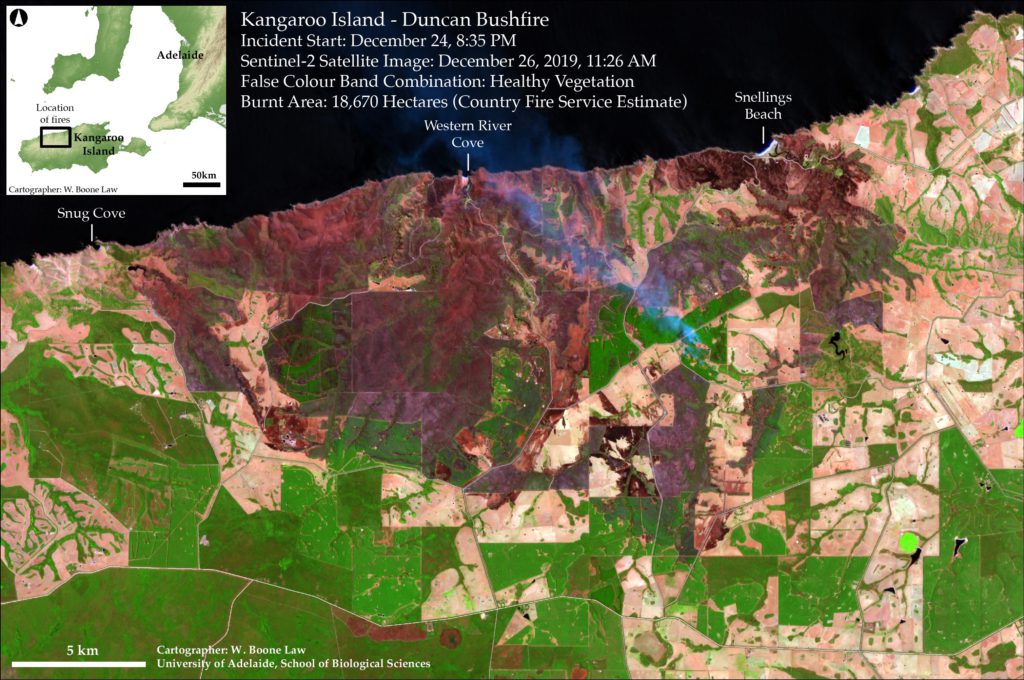
The Duncan Fire was started by lightning strikes in the Western River area on December 24, 2019. Two days later, more than 18,000 hectares had burnt. The Sentinel-2 image below shows a false colour depiction of that emphasises healthy vegetation, clearly showing dead, burnt areas of grass, eucalypt woodlands, and plantations. Smoke can be seen billowing from an active fire approximately 8km south of Snellings Beach.
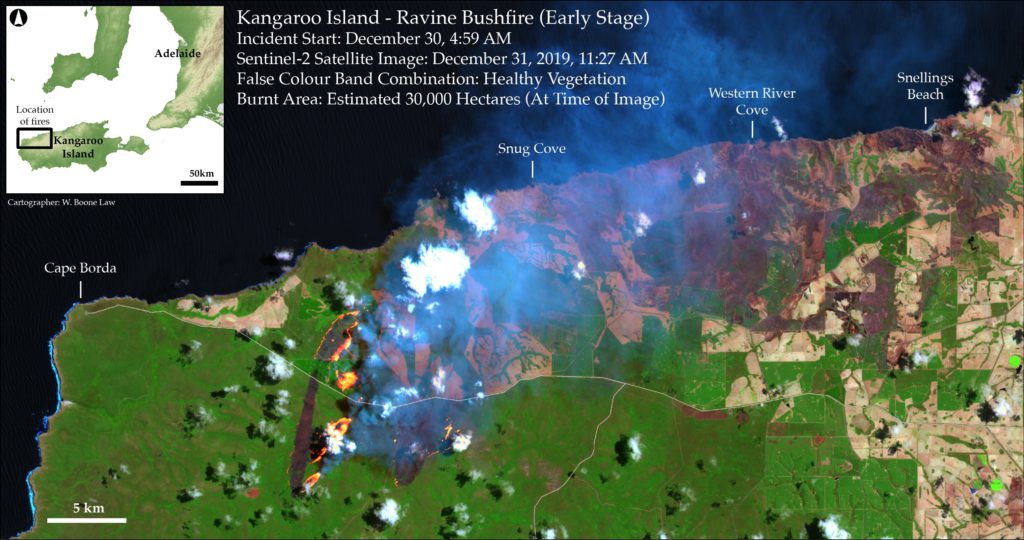
Following the Duncan Fire, lightning strikes in the northwest area of the island started fires in the isolated and remote Ravine des Casoars Wilderness Protection Area. The image below depicts the early stages of ‘the Ravine fire,’ as it became commonly known. Here, I use a wildfire visualisation algorithm with false colour band combination to show heathy vegetation vs. burnt vegetation. Dominant northern winds pushed the fires southward into Flinders Chase over the next three days.
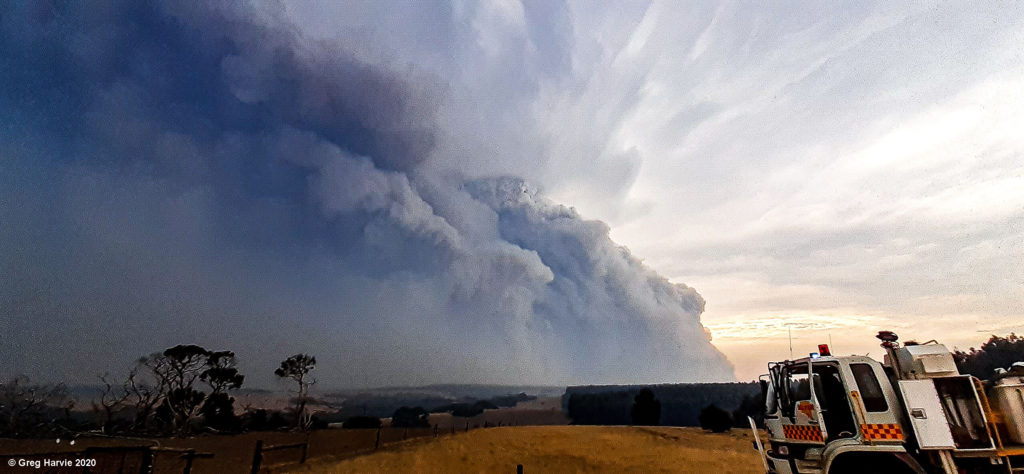
Late in the day, on January 3rd 2020, a southwestern wind change ushered the fires in a northeastern direction from the Flinders Chase National Park area towards Parndana and Stokes Bay. Local photographer and CFS Volunteer, Greg Harvie, captured a powerful image of the monstrous wind change that pushed the bushfire across the island. He kindly shared the image with permission below.
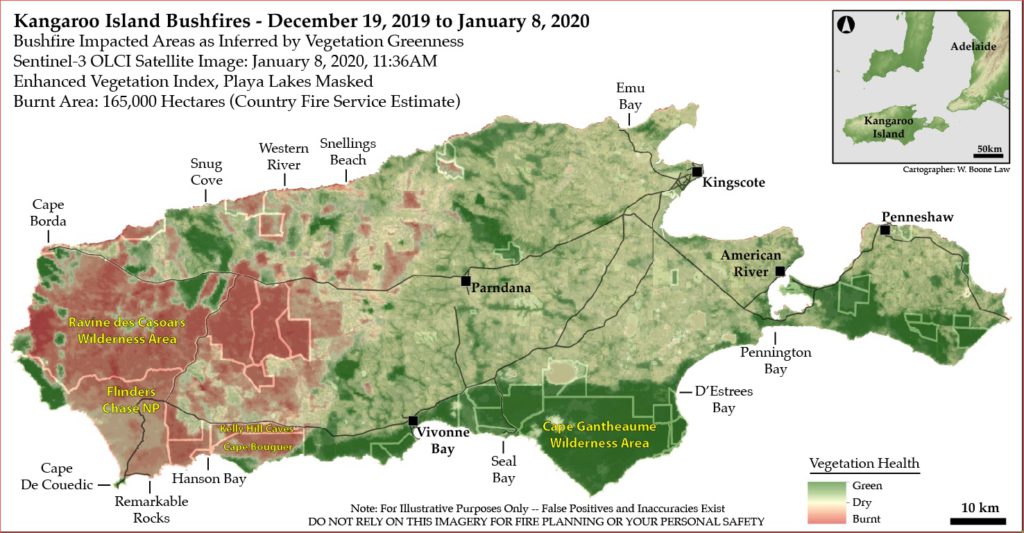
As the fires rushed towards the northeast, an angular ‘fire-front’ line formed. The east edge of the front can be seen in much of the imagery from this time, as in this Sentinel-3 image from January 8, 2020. This coarse grained Sentinel-3 image (330m pixel resolution) was one of first images I processed to show the extent and direction of the fire front. Vegetation indices such as the Enhanced Vegetation Index, depicted here, are widely used to show living vegetation cover. The processed image below shows the distribution of native vegetation and plantations (dark green), pastures and crops (light green) and burnt areas (shades of red).
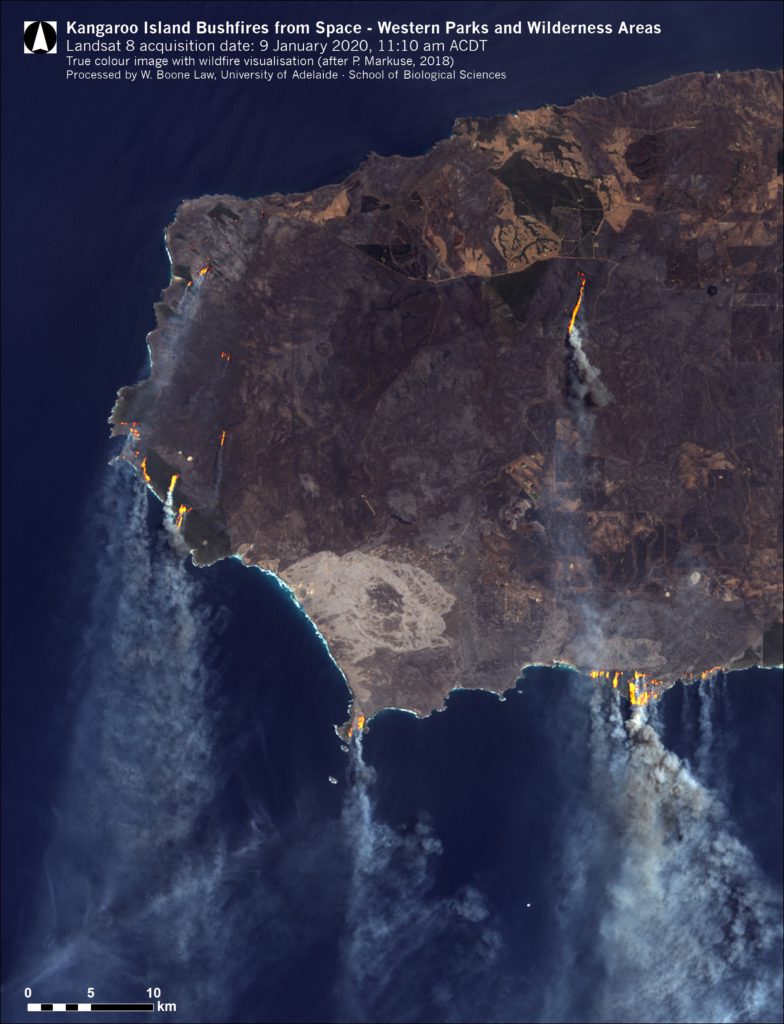
This true colour Landsat-8 image from January 9th 2020, captures the patchiness of active wildfires across the western end of the island. At this point in time, the fires has consumed most of Ravine des Casoars Wilderness Protection Area and Flinders Chase National Park. The smoke from the fires could be seen from space. Note how burnt areas are not clearly identified in a true colour image. False colour band combinations, as seen in subsequent image examples, offer better visualisation of bushfire impacted lands.
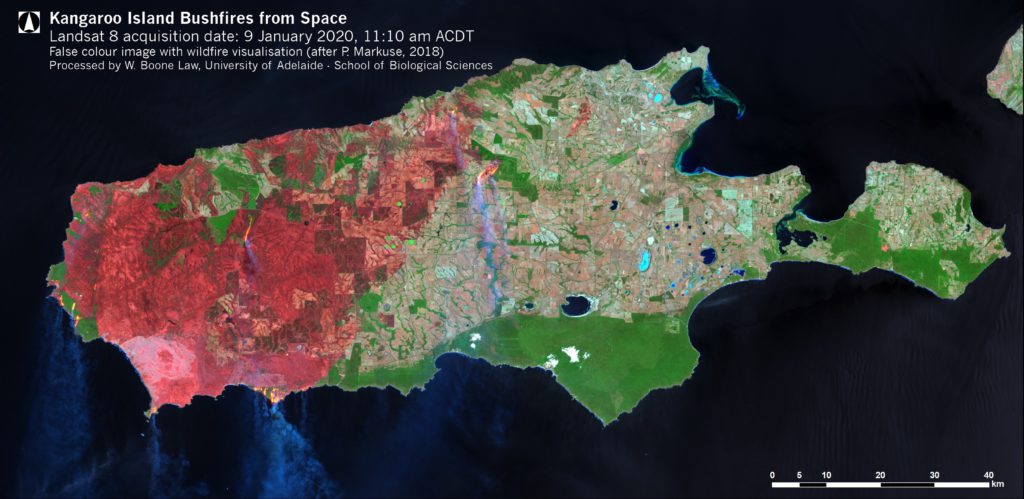
The full extent of bushfire impacted areas on January 9th 2020 can be seen in the following false colour Landsat-8 image. Active fires are evident from smoke in the central and western areas of the island. Burnt areas are delineated in deep red. Healthy vegetation is green and dry farmlands appear tan.
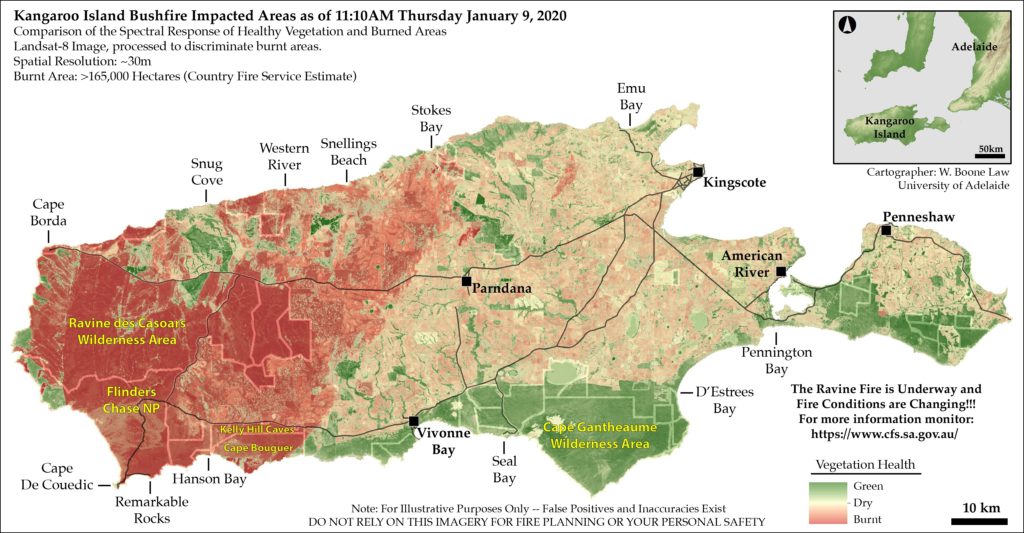
In these final two images I use a customised variant of processing algorithm called the Normalised Burn Ratio to look at burnt area variability and view the general outline and aftermath of the blazes. The image below shows variability amongst the burnt areas as processed using a Landsat-8 image on January 9 2020. Patches of remnant habitat remain along much of the west coast. In addition to the massive fire-impacted area in the west of the island, the outline of the Menzies bushfire (which burnt weeks earlier) is noticeable southwest of Emu Bay. Also seen in this image are the first stages of the Bark Hut Road fire (north of Parndana). This fire, as well as other spot fires, moved into the central farmlands and eventually surrounded the Parndana township.
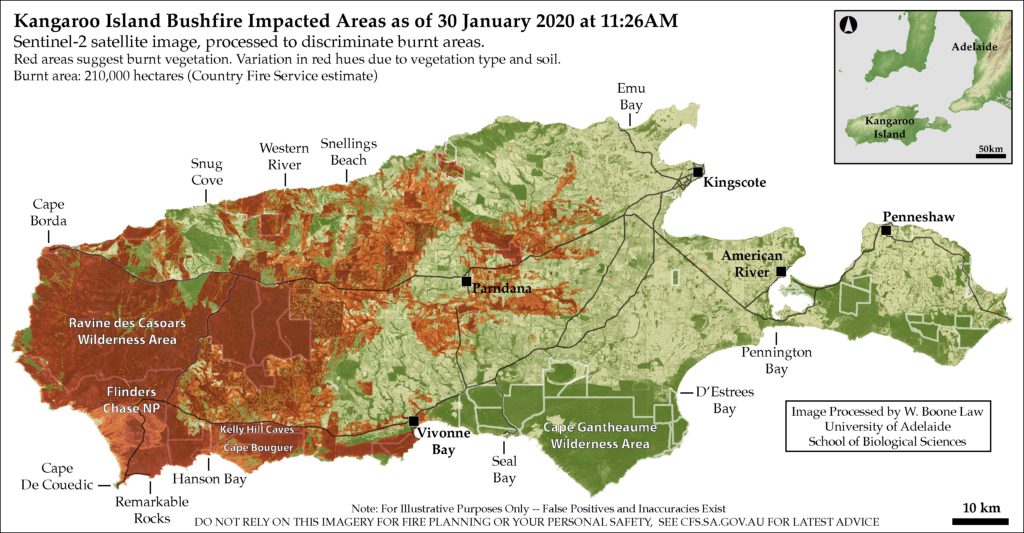
This final map depicts burnt areas as processed from a Sentinel-2 image on January 30 2020. Red and orange areas represent burnt tree canopy and grasses. Sadly, much of the remnant habitat along the west coast has disappeared, but the fires were well under control by this time. More than 50mm of rain fell within 48 hours of this image, and the fires were well and truly under control.
To assist recovery efforts, I have prepared A4-sized detailed maps (PDF) of this final image, zoomed into much more detail than presented above.
Further Information
There are many more advanced processing methods that can be used to investigate the bushfire extent and impacts on Kangaroo Island. The examples here are intended as an introduction to the remote sensing and geospatial work we conduct at the University of Adelaide. In the coming year, we hope to expand upon this research to assist recovery efforts on Kangaroo Island and elsewhere in South Australia.
Interested in a project or application of this kind of research? Please contact:
- Professor Megan Lewis
- Spatial Information
- Environmental Remote Sensing and GIS program at the University of Adelaide.
Read Boone's full article in The Conversation and find out more about his bushfire mapping experience, during the fires on Kangaroo Island.

Newsletter & social media
Join us for a sensational mix of news, events and research at the Environment Institute. Find out about new initiatives and share with your friends what's happening.

