Where's the t?
Once upon a time, I lectured Maths 1A calculus, and when I got to teaching hyperbolic trig functions I put a great deal of effort into making sure they were well-connected to other ideas the students knew. So I listed the properties of ordinary trig functions and alongside I listed the matching properties of hyperbolic trig functions.
One of the major differences/connections is that as the value of t changes, the point (cos t, sin t) traces out a circle with equation x2 + y2=1, whereas the point (cosh t, sinh t) traces out a rectangular hyperbola with equation x2 - y2 = 1. I showed them how this happens using GeoGebra.
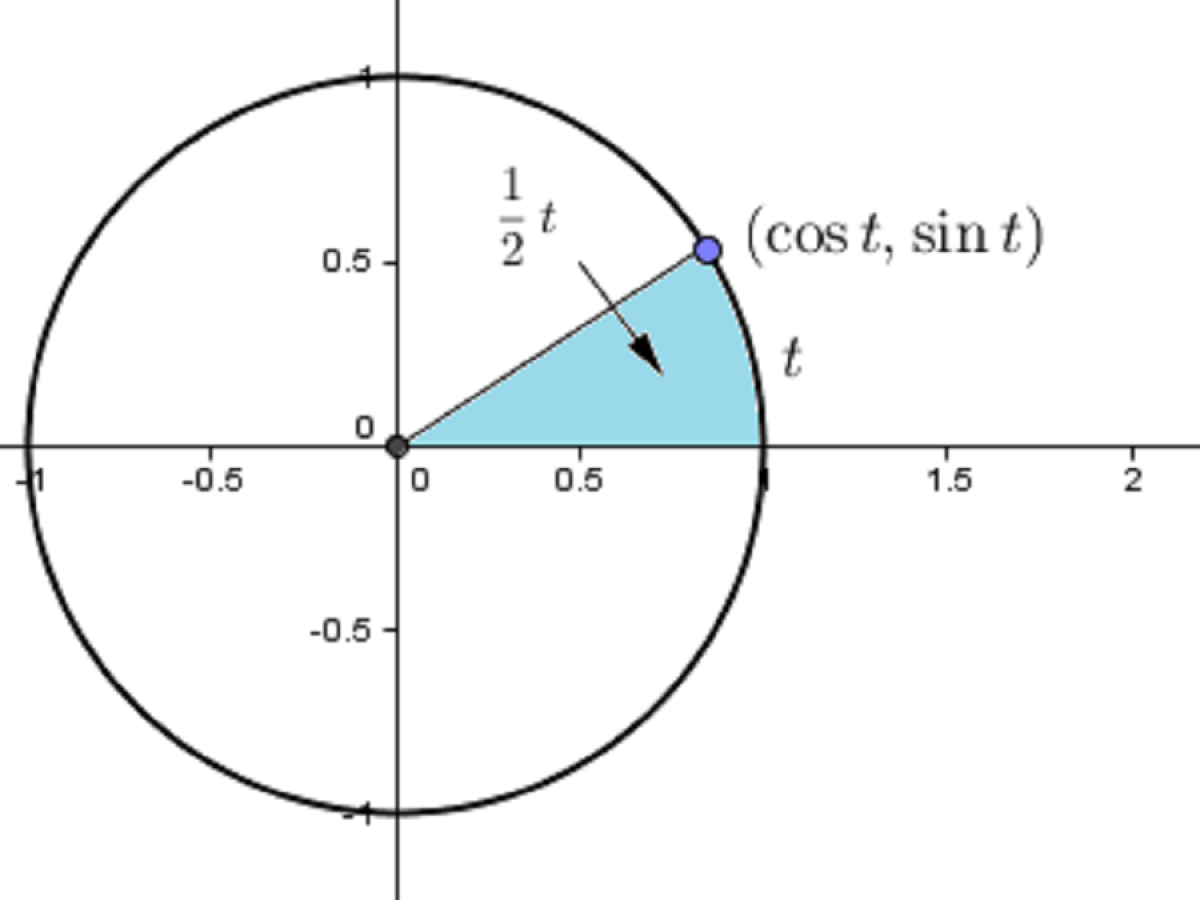
This was very well received by the students. But after the lecture, one of the students came up and asked me what the t represented for the hyperbolic trig functions. With the trig functions, t is very well defined as the distance measured anticlockwise around the circle starting at the point (1,0): If you go a distance t along the edge of the circle, then the point you come to is (cos t, sin t). That's very pleasant.
But what is t for the hyperbolic trig functions? It's certianly not the length along the curve. In fact, there is (and can be) no formula for the arc length of a hyperbola using your standard suite of functions. I had to admit to the student that I didn't know and that I wasn't sure it actually had a geometric interpretation at all.
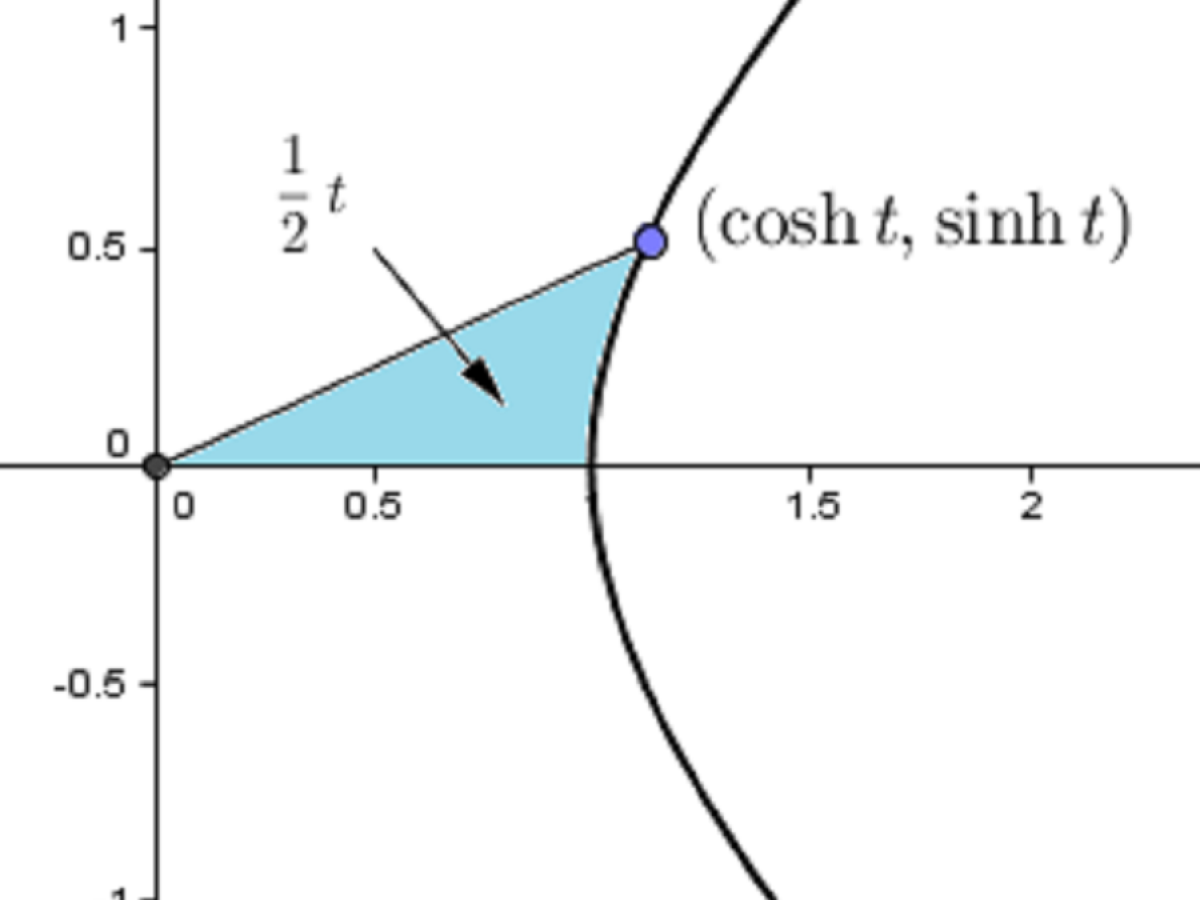
Well, it turns out I was wrong. There is a very good geometric representation: the value of t is not a length but an area!
What you do is draw a line from the origin to the hyperbola, and allow that line to sweep out an area as your point moves along the hyperbola. When this area is t/2, then the point you come to is (cosh t, sinh t). Cool huh? (Finding that area using integrals that don't involve using cosh and sinh is a tricky exercise though!)

And the best part about it is that the area interpretation is true for the trig functions too! When the length around the unit circle is t, then the area of the sector created is t/2 (by the formula for the area of a sector). So we have the same interpretation for both!

I love it when things work out so neatly.
PS: A handout comparing the properties of trig and hyperbolic trig functions can be found here. I didn't do it earlier because it gives away the punchline in the first row of the table!
